Animated N-Pie Chart in Flutter
Create Animated Pie Charts like a PRO

With 11+ years of experience in IT industry, I have got my hands into many tech stacks - mobile app development, data analytics, backend using Java/Kotlin.
I expertise on Android(Kotlin) and Flutter(Dart).
I also run a educational YouTube channel with name TECHIE BLOSSOM.
Hello Flutter Learners, I saw a micro-animation in the OneFootball app. This animation shows a pie chart with 3 sections each representing the number of wins, losses and draws for a team in one season.

The above gif shows the animation in slow motion and might not give you a good impression of its smoothness. If you want to see it smooth, you can watch the video as well. I also created a video tutorial explaining every step in detail.
And, if you're more of a person who likes it written instead of videos, this tutorial will have you covered. This is not a transcript of the video tutorial, but an overview of how these types of animations are created in Flutter.
After reading this, you'll be easily able to create different types of pie charts as well.
What is required?
When is this animation supposed to run?
This animation will run once a page visit. So, let’s say we useAnimationController, then we’ll run the controller in the forward direction and never worry about if we've to re-run it in the forward direction or reverse direction anytime soon.How many sections?
There are possibly only three outcomes of a match - win, loss or draw. So, in this Pie chart, we will always have a maximum of 3 sections. Once, you’ll learn how these three are animated, you can later extend it to take N number of sections.All the sections will start simultaneously from the top centre.
Creating Arcs
We need multiple arcs to create a pie chart. In Flutter, we can use CustomPaint widget to create custom shapes like arcs, circles, paths, polygons and whatnot. The CustomPaint uses a CustomPainter that gives you access to a Canvas.
You can draw anything on canvas. Texts, lines, polygons, arcs, ellipses, parabolas, hyperbolas, circles, etc.
Let's consider that in a season a team Manchester City played 40 matches. Out of which they won 25, drawn 10 and lost 5 matches.
Take 3 sections for now and I will highlight how to make it work for N number of sections.
class ProgressPainter extends CustomPainter {
    @override
    void paint(Canvas canvas, Size size) {
        final center = Offset(size.width / 2, size.height / 2);
        final radius = size.width / 2;
        canvas.drawArc(
              //1
              Rect.fromCircle(center: center, radius: radius),
              //2
              math.radians(-90),
              //3
              math.radians(winProgress),
              //4
              false,
              //5
              winPaint,
            );
    }
}
This is what happens with the above code:
In the first parameter, we define the bounding rectangle of the arc.
The second parameter denotes the start angle for an arc. The 0° is at the right end of the rectangle. To start from the top centre, you need to move 90° in the anti-clockwise direction.
The next parameter denotes the sweep angle of the arc. For Manchester City, the sweep angle for wins will be 225°.
$$win = \frac{25}{40} * 360° = 225°$$
The fourth parameter is a flag to denote whether to use the centre or not while drawing arcs.
The last parameter is for paint which will define the colour of the arc, stroke width, stroke edges, gradients, etc.
Drawing other arcs
You saw the formula above to find the sweep angle for wins. To find the sweep angle for other sections you can replace the 25 value with their respective values. Like to find draw degrees you would use 10 and 5 for loss. Well, this looks easy when you know the number of sections.
But, that's not too easy because you want to make it generic for N number of sections. Let's see how you can handle this scenario.
Finding total
To find a total, you can use the fold operator on the list of data. Imagine you have the below dataset:
final dataset = [
  Data('Fruits', 2000),
  Data('Entertainment', 1500),
  Data('Health', 2500),
  Data('Travel', 1000),
];
The Data class has label and value fields. The dataset is a list of sections/data here.
final total = widget.dataset.fold(0.0, (a, b) => a + b.value);
Let's see how the fold operator works:
The initial total is 0.0, which is the first parameter of the
foldoperator.In the first iteration, the
ais 0.0, andbis the first data from the dataset. The sum ofvaluefrom the first data i.e. 2000 and the initial value 0.0 is assigned back toa.In the second iteration, the
valuefrom the second data is added to the newa. By the end of this iteration, the value ofais now 3500.The
foldoperator will continue this until the end of the list and you'll get the total of values.
What is the total in terms of the Pie?
It's worth remembering that a Pie is a whole circle that draws a 360° sweep angle irrespective of its start point. And that's why the total you just calculated is equivalent to 360°.
It will be harmless to divide the total by 360, because to calculate the sweep angle for sections, you have to divide the fraction by 360. (Refer to the win formula).
Adding the sweep angles
Let's dry run for what we've done so far. The win, draw and loss sweep angles will be 225°, 90° and 45° respectively. The arcs will start from the top center and the order of declaring drawArc will decide which arc is on top, middle or bottom. Will the Pie be complete or it will be visible only till 225°?
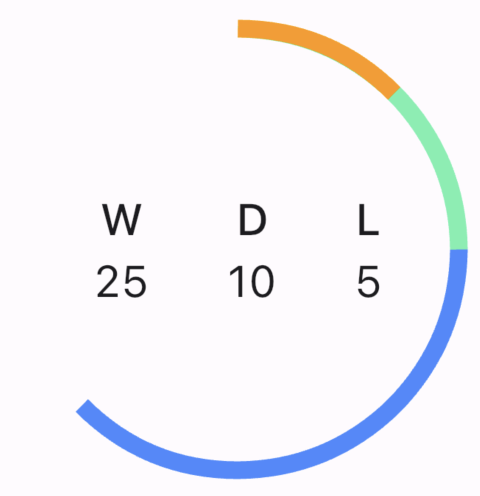
The order of arcs in the above pie is win is the bottommost (Blue), draw is in the middle(Green) and loss is the topmost arc(Orange).
This is not what we want to draw. The green arc should be visible after the blue arc and the orange arc should be visible after the green arc. NO. This is not how this animation should be interpreted especially when we want to replicate the one from the OneFootball app. This particular Pie chart has overlapping arcs. They don't start after others.
Remember, what was the third requirement? All sections should start from the top centre. Check the gif above again. The overlapping is required. If we were not to animate this chart, we could've avoided overlapping. But, we have to animate it.
Let's see the proper solution now.
Cumulative Sweep Angles
Just think how you can show the win arc on top and draw the arc at the bottom, given their angles are 225° and 90° and have the same start angle.

The above image is to explain to you the layers of the pie chart. The blue arc is for a draw and the black is for wins.
The solution is to add win value and draw value to find draw degrees. So, as per our example, the draw degrees will be 225° + 90°, and we can get this by adding win and draw.
Similarly, for loss degrees, you'll add win, draw and loss. And, this loss degree or you can say the sweep angle of the last data in the dataset will always be 360. As the sum of all values is going to be the whole Pie. I hope you understand. If not, try reading it again or see the video tutorial.
Again, this looks pretty easy for limited sections. But, how do you handle this for N sections?
//1
double currentSum = 0;
final sweepAngles = dataset.map((data) {
    //2
    currentSum += data.value;
    return currentSum;
}).tolist();
The above code is just a sample to explain. You can find the actual code on GitHub.
Here, the map operator on dataset returns a list of sweep angles, that will refer to each data value. Let's decode:
The
currentSumvariable will hold the sum of sweep angles.On each iteration, add the value to the current sum. So, for the first iteration, in case of win the
currentSumwill be 225°. For the second iteration, in the case of draw thecurrentSumwill be 225° + 90° = 315°.
This small piece of code does the magic.
Colors play an important role
Even though you've mastered calculating the dynamic sweep angles, the pie won't look perfect. The blue-coloured arc will overlap with the black-coloured arc.
Because there is animation and all arcs should start from the top centre, the colour of arcs should have opacity. This will make sure that all arcs are visible even if they are at the bottommost layer.
That's why I chose Colors.black for wins, Colors.black38 for draw and Colors.black26 for loss arc.
Animating the Arcs
If you've been following my video tutorials or written tutorials, you already know we'll use AnimationController and set of tweens to animate this.
You need a list of tweens that will hold sweep angles for the sections. So, if you've 5 sections then you'll have 5 tweens.
controller = AnimationController(
    vsync: this,
    duration: const Duration(seconds: 4),
);

double currentSum = 0.0;
animations = dataset.map((data) {
    currentSum += data.value;
    //1
    return Tween<double>(
        begin: 0,
        //2
        end: currentSum,
    ).animate(controller);
});

//3
AnimatedBuilder(
    animation: controller,
    builder: (context, child) {
        return CustomPaint(
            child: ProgressPainter(
                //4
                progress: animations,
            ),
        );
    }
)
Here's what the above code does:
For each element in the dataset, the
mapoperator returns aAnimationofdoubletype that holds the sweep angle value.When the controller runs, the initial sweep angle is 0° and it gradually reaches the desired sweep angle with the controller reaching 1.0 value.
Using the
AnimatedBuilder, you can pass in thecontrollerso that the builder re-builds when there is a change incontroller's value.You can pass the list of animations to the painter. And the painter can again run
mapoperator on this to create N arcs.
Congratulations 🎉 for completing the article. I believe that you've learnt something or other from this and can create any type of pie chart. But, if you find it difficult to understand, feel free to comment here or watch the video.
If you liked this article, then you know what you’ve to do. You can connect with me on Twitter and learn from my YouTube channel.
I am also available to direct 1:1 calls or Mentorships or Pair programming on TopMate.
I often share my code on GitHub.


